When automating triage quietly costs you money
Automating GitHub issue triage looks like an easy win. The work is repetitive, a model does it in seconds, and the math looks great on a slide.
I measured it on 1500 closed issues across three real codebases - scored against the labels the maintainers actually applied. Not against my own judgment, no self-grading.
The result that matters isn’t the cost savings. It’s this: on one of the three repos, automating would have silently mislabeled one issue in three - and the overall accuracy number gives you no warning.
The bottom line
The cost case is real but boring. Manual triage runs about 4 minutes per issue at a loaded engineering rate of $75/hour - roughly $5.00 per issue. The model labels one issue in 2.5 seconds for $0.003. Building it and wiring it to GitHub costs about $2,700 (~36 engineer-hours to build and wire to webhooks - your number will vary).
So the per-issue economics are overwhelming. But per-issue economics aren’t the decision. Two things decide it: how many issues you actually get, and whether you can trust the model to know when it’s wrong. Get either one wrong and the project either never pays back or quietly degrades your data.
Here’s what the three repos looked like:
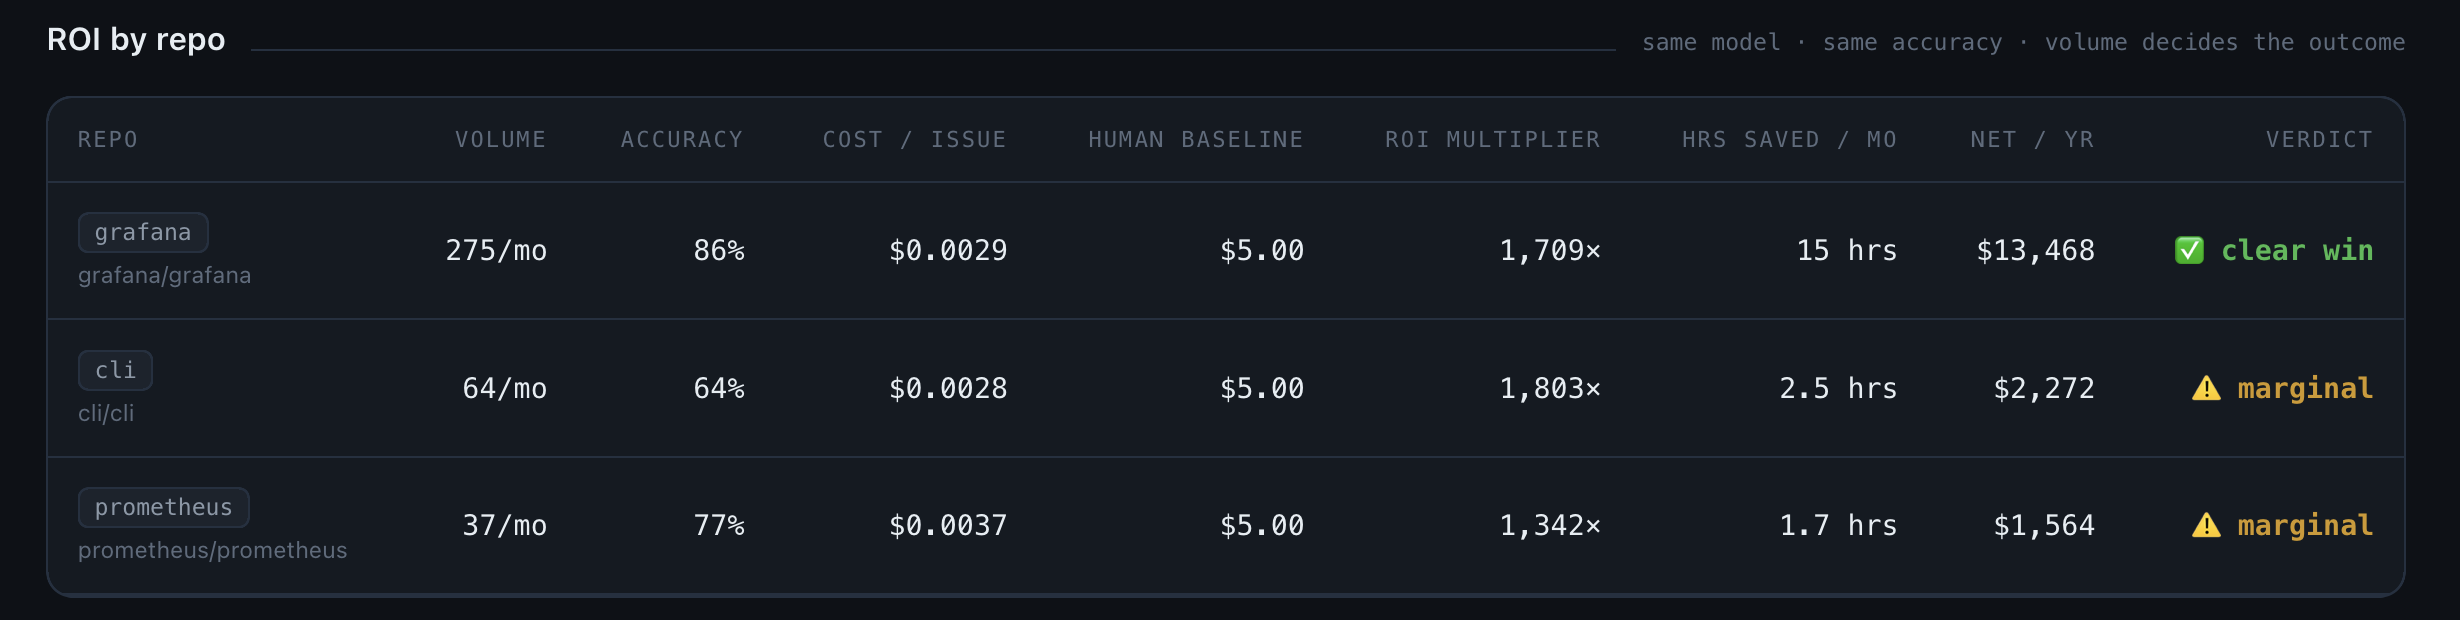
Same model, same method, three different verdicts.
Why the accuracy number isn’t enough
Across the three repos, overall accuracy ranges from 64% to 86%. If you stop there, cli/cli (64%) just looks like the weakest of three otherwise-similar options. You’d probably still automate it.
That would be the mistake.
The question that actually decides safety isn’t how often is the model right - it’s does the model know when it’s uncertain. A model that’s mediocre but honest about its uncertainty is safe: you auto-apply the labels it’s confident about and send the rest to a human. A model that’s just as confident when it’s wrong as when it’s right is dangerous: it mislabels quietly.
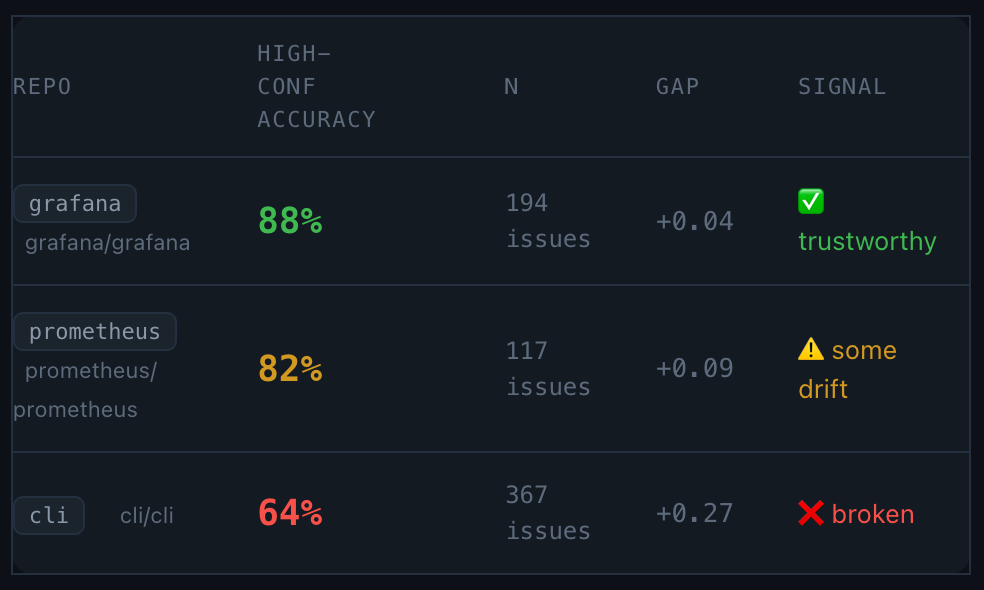
Measured that way, the three repos split apart:
- grafana: When the model is confident, it’s right 88% of the time. Its confidence tracks its accuracy almost exactly. You can trust the high-confidence tier and auto-apply it.
- prometheus: Confident predictions are right 82% of the time. Slight overconfidence, but close enough to use with light review.
- cli/cli: Confident predictions are right only 64% of the time - no better than its overall average. The confidence signal carries no information. There’s no safe subset to auto-apply. Ship it here and you accept a one-in-three error rate.
That’s the finding. Same accuracy range, opposite decisions — and you can’t see the difference without measuring the calibration separately.
Two honest caveats
I’d rather you trust the smaller number than distrust an inflated one, so two things to keep in mind:
Maintainers disagree with each other. At 86% agreement on grafana, we may be bumping against the human-to-human ceiling - some of the remaining “errors” are cases where two maintainers would have labeled it differently too. That gap isn’t a model failure; it’s the natural ceiling of the task.
I can only check the model on issues the maintainers already labeled. That’s 41% of grafana, 26% of prometheus, 90% of cli/cli. Here’s the catch. The issues people bother to label are usually the easy ones. So when I test on that slice, the model looks better than it would on the messy, unlabeled rest. That’s why grafana’s 86% is the rosy number — it’s measured on the thinnest, easiest slice. cli/cli is the opposite: 90% labeled, almost no easy-case bias. So its broken calibration is real, not a measuring artifact.
How I measured this (the full method, for anyone who wants to check)
Ground truth
Closed issues were pulled from three public repositories. The maintainers’ own labels are the ground truth - the model’s prediction is scored against what the human maintainers actually applied. Nothing is graded by the model itself.
The cost model
- Human baseline: 4 minutes per issue × $75/hour loaded rate = $5.00 per issue. The engineer reads the issue, picks a label, sets priority.
- With the model: wrong predictions still need full human review. Correct predictions need only a 20% spot-check at ~1 minute each.
- Saved time = (issues × 4 min) − (wrong × 4 min + right × 20% × 1 min)
- Break-even: net savings turn positive once monthly volume is high enough that saved engineer time exceeds the build cost (~$2,700) plus ongoing API cost. This is why prometheus takes ~21 months despite decent accuracy - at 37 issues/month there simply isn’t enough volume to recover the build quickly.
Calibration
For each prediction the model also reports a confidence score. I bucketed predictions into high (≥0.8), medium (0.5–0.8), and low (<0.5) confidence, then measured the actual accuracy within each bucket. The “calibration gap” is the difference between average confidence and actual accuracy:
| Repo | High-conf accuracy | n | Gap | Verdict |
|---|---|---|---|---|
| grafana | 88% | 194 | +0.04 | Trustworthy |
| prometheus | 82% | 117 | +0.09 | Minor drift |
| cli/cli | 64% | 367 | +0.27 | Broken |
A small gap means the model’s confidence is honest. cli/cli’s gap of +0.27 - identical to its overall accuracy deficit - means it is exactly as confident on the issues it gets wrong as on the ones it gets right.
What I did not measure well
- Per-class balance. grafana’s 86% is label-level agreement; the macro F1 is 0.40, carried by the dominant bug class. Rarer categories (security, CI) are where it slips. The headline accuracy flatters the rare cases.
- Priority accuracy. Only meaningful on prometheus (57%, n=53). The other two repos had too few priority-labeled issues to report.
- Duplicate detection. Insufficient labeled duplicates to score meaningfully.
Cost and latency
$0.003 per issue, ~542 input / 87 output tokens average, 2.5 seconds wall-clock per issue.
Code and the reproducible scoring are linked below - every number on this page comes out of results/scores.json.
If you’re weighing this for your own tracker
The shape of the answer depends on two numbers: your monthly issue volume (decides whether it pays back) and whether your model’s confidence is actually calibrated on your data (decides whether it’s safe at all). You can’t borrow either from someone else’s repo - grafana’s answer is not cli/cli’s answer.
Code + reproducible scoring: github.com/dagolovach/issue-triage-eval
June 2026